
Online marketing is a vast and complex web of algorithms and undisclosed rules that influence every business engaging in it. The advent of online ads and ad services brought all sorts of metrics that go into calculating an ad quality score and these can vary from platform to platform. These scores can influence how expensive advertising can be and are thus a crucial factor in any online marketing strategy. Sadly, very little is available about the nitty gritty details of every platform but we do know that they each weigh things a little differently. These differences put a weight on any PPC campaign a company may start.
When it comes to online promotion, PPC advertising is one of the main prongs of marketing. The existence of various ad networks compounds the complexity of this market, each with its own spin on calculations. These ad brokers play a crucial role as they decide costs per click and control the flow of ads across the Internet. This makes ad networks powerful outreach tools, considering that the Google display network alone reaches 90% of Internet users worldwide.
That’s where quality scores come in. An ad quality score can influence the price of a placement in conjunction with various other factors. This is essentially one of the elements of the invisible hand of the advertising market, determining prices through various forms of audience interest. While there are many factors (both known and unknown ones) that can play a part, quality scores have elements that businesses should keep their eye on. They can, in effect, increase their ability to bargain for a better return on investment if they know how these scores are calculated.
What is an Ad Quality Score?

Google pioneered ad relevance calculations by introducing this method of scoring with their ad rank algorithm. An ad quality score is essentially a quantification of the value of the keywords for your account and ad’s relevance to a target audience. These, together with the cost per click (CPC) bid the user places, determine the overall ad rank you get. These ad relevance and quality score calculations rely heavily on how well the landing page does in terms of a number of measures.
Generally, users can improve these by adding a better user experience, improving keywords, and getting higher CTRs in specific demographics. These are dependent on different target groups and how they interact with your site or the quality score of keywords you employ. As a result, a score can be higher with one target group but lower with another. In this way advertisers that show less relevant to uninterested users will receive far lower scores, thus having to pay a higher CPC.
Ordinarily, the score is represented as a number between 1-10 on most platforms. This number will be a direct indication to the ad network about how much to charge each advertiser per click or impression. The ad rank is the result of the quality score multiplied by the CPC bid that the advertiser places.
How are Ad Quality Scores Determined?
However, the real issue arises from how each different network has a slightly different means of calculating quality scores. There are a few broad categories of factors that can influence the end score. Not all companies use every one of these and there are many extra, unknown calculations that sometimes add up to the final output. These five can be a handy checklist for how to check where your ad quality score may be lacking.
The following cover the main broad categories:
- Landing Page Experience: This measure relies on whether the landing page after the ad is relevant to the visitor. It checks for whether pages match the visitor’s intent and whether it helps them accomplish their objectives quickly and transparently.
- Ad Click Through Rate/Engagement: This measures compares how well your ads clickthrough rate stacks up against competitors.
- Ad Relevance: Whether your ads align with your audiences’ interests and intent.
- Post-Click Conversion Rate: Do visitors end up taking a meaningful action after the click.
- Recency: How recently you update or publish ads/ content.
These measures can form some pretty neat guidelines for how to improve your standings on various platforms. Of course, since each platform’s calculation metrics vary, you don’t have to improve every one of these categories. Rather, aim for the ones that apply to your chosen network.
In general, it’s best to make sure your landing page is user-friendly, quick to load, and the information is easy for user’s to find. This will decrease bounce rates and serve as a major component of the quality score calculations, lowering the cost of PPC campaigns.
How Platforms Calculate Scores
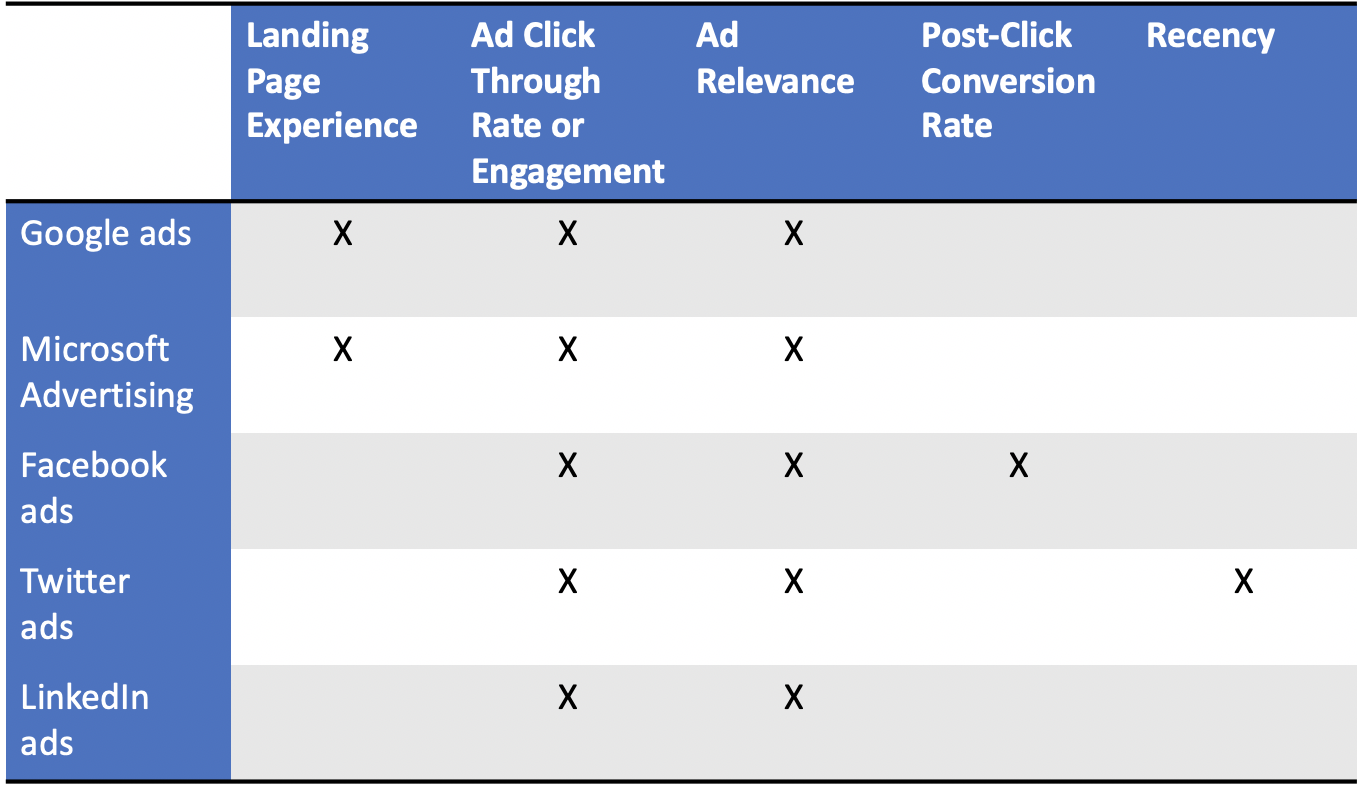
The table above is a pretty handy illustration of what rules to play by when adjusting ad quality scores for different networks. The main platforms all take advertising CTR, engagement, and relevance into account but the specifics of the rest can vary.
Google and Microsoft Advertising use similar metrics on a surface-level but there are a few deeper differences. For example, Google emphasises landing page load times, security, and applicability to multiple devices. One difference that Microsoft applies is that of lowering bounce rates to improve the quality score. In general, a lot of the same principles are cross-applicable between these two networks, so its best to treat them as similar.
Facebook has a very different method for a number of reasons (which we’ve previously covered). Firstly, it doesn’t rely on search keywords, so a lot of the standard measures of intent go out the window. Additionally, Ad CTR, Relevance, and Post-click conversions all play a major role, with Facebook comparing these measures. However, conversions are heavily reliant on the reactions people have on Facebook (likes, shares etc.). The comparisons pit ads against each other when they target the same group, thus deriving a score.
Twitter ads can be similar to Facebook’s in this regard, as most of the conversions happen with likes, retweets, and follows. They also take note of recency of posts, implying that constant content is favourable. LinkedIn is notoriously unhelpful in telling users how they calculate their scores. They tend to use engagement metrics and CTR as the main measures and improving UX on the landing page helps decrease CPCs on the platform.