
Google Lighthouse: An Easy Tool For Website Optimisation
If you need to get your website running efficiently, there are several things you have to keep in mind. Luckily, versatile tools like Google Lighthouse can keep helping you optimise and keep track of factors like Performance, Accessibility, and so much more.
It does this by running an audit analysing information on a web application or website page. In doing so, it compiles a report on how well the app or page performed. It checks the webpage with a low-performance standard to see how well it would fare against a bad connection or older device, giving useful information on how it operates under less-than-standard conditions.
Although its primary focus is web applications and mobile sites, it still provides a lot of useful information and recommendations that one can apply to any website. As a means of monitoring how your website is doing alongside multiple useful metrics, it is indispensable.
How to Use Google Lighthouse
There are many ways to make use of Lighthouse, and the best one may depend on what you’re most comfortable with. The various workflows include:
In Chrome DevTools: Easily audit pages that require authentication, and read your reports in a user-friendly format. Using Google Chrome, you can audit any URL on the web by accessing Chrome DevTools with this procedure:
- Load the page you want to audit in the Chrome browser.
- Open Chrome DevTools.
- Windows: F12 key, or Control+Shift+I, Mac: Command+Option+I
- From Chrome’s main menu: Click “Customize and control Google Chrome” in the upper right corner, then select More Tools > Developer Tools.
- Click the Audits tab.
- Click the “Run audits” button
From the command line: Automate your Lighthouse runs via shell scripts, using it as an extension of Google Chrome. Click the Lighthouse icon next to the Chrome address bar.
As a Node module: Incorporate Lighthouse into your continuous integration systems.
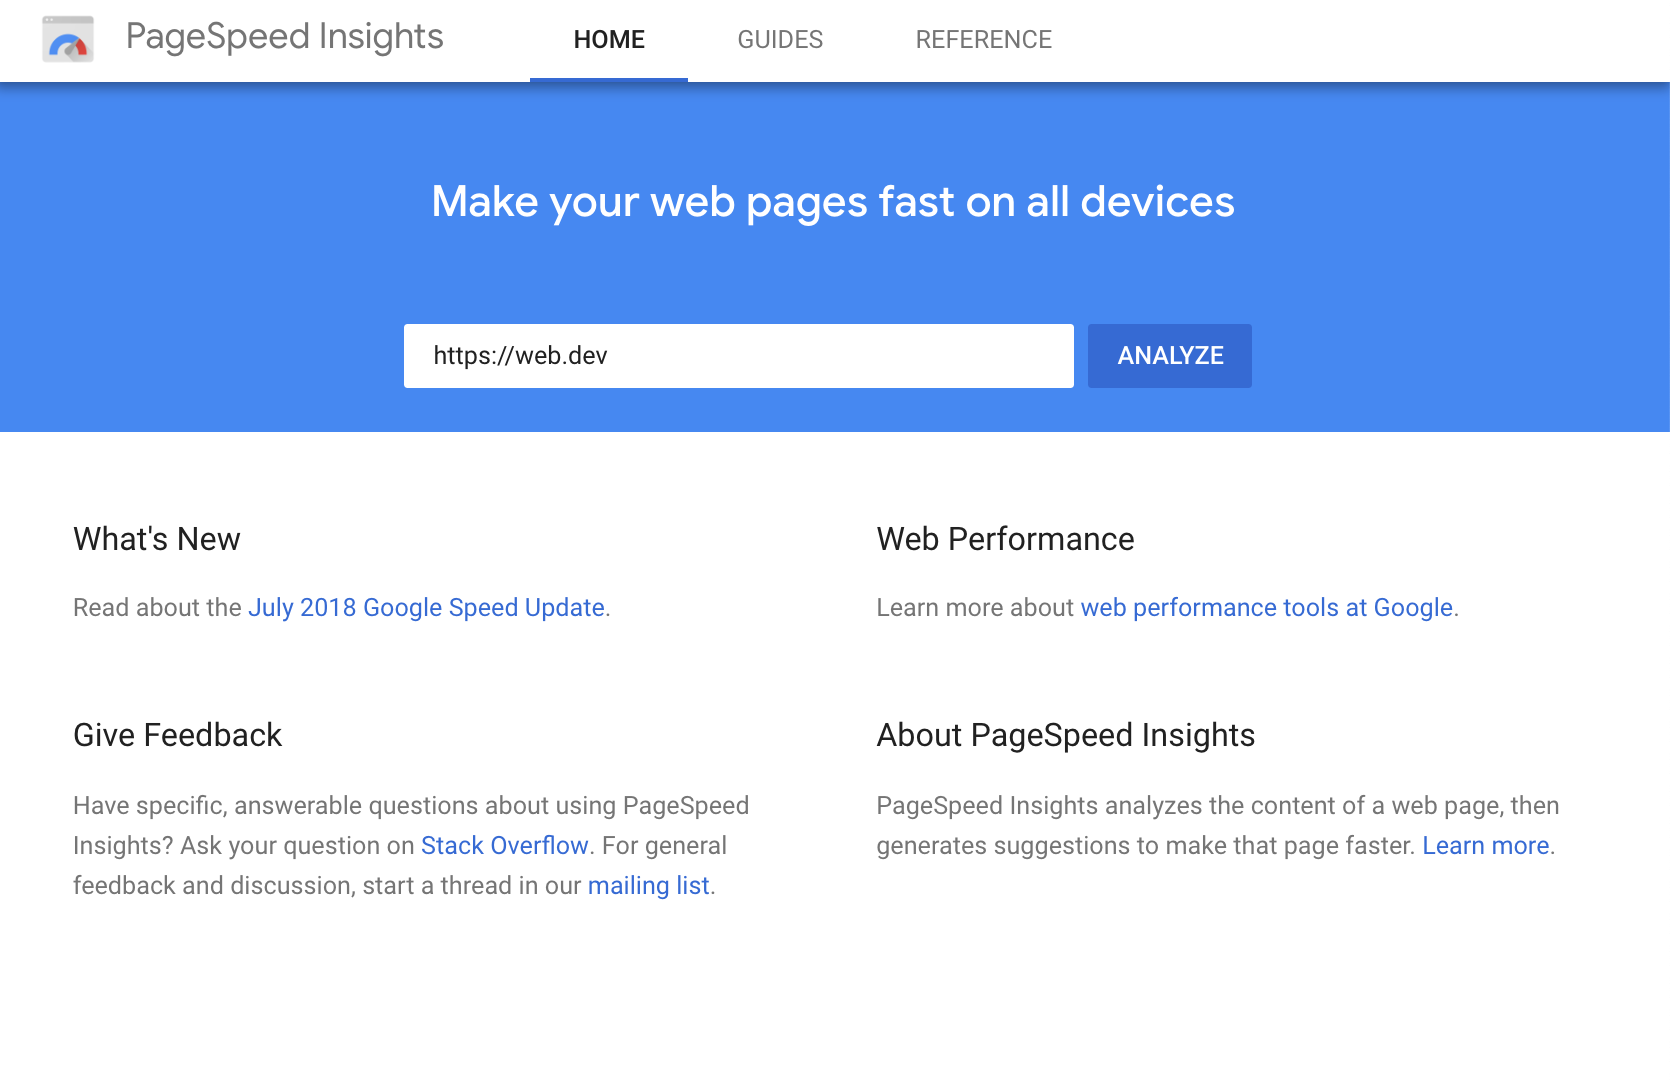
From a web UI: Run Lighthouse and link to reports without installing a thing. In this version, you can insert the URL in the Measure page to run the audit. It will take a few seconds, and you should see the detailed reporting with the overall scoring.
Main Metrics
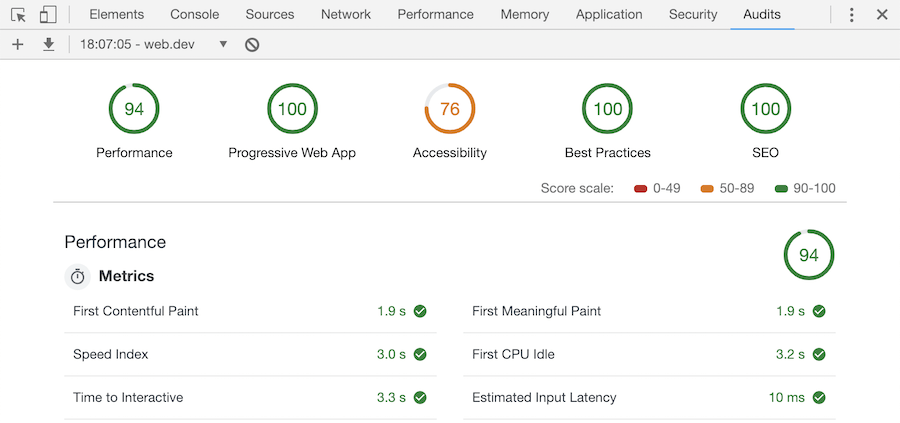
Put simply, Lighthouse is a website monitoring and evaluation tool that runs audits for performance, accessibility, progressive web apps, SEO, and a lot more (it tests more than 75 metrics in total). These data metrics cover nearly everything you need to know to fix up the website and make it more appealing and visible.
Performance
The performance metric mainly deals with speed, latency, resources optimization etc. First Contentful Paint is a measure of how long it takes for content of any kind to appear onscreen.
- First Meaningful Paint: The duration required for the first meaningful content to appear onscreen. A lower score indicates that the page is faster.
- Speed Index: A site speed test that shows how quickly the full contents of a page are viewable. The index is based on a load time under 1.25 seconds.
- First CPU Idle: The duration between loading and when the device is no longer working to render the page.
- Time to Interactive: How quickly the page becomes interactive. This measure mostly looks at how much time it takes for most of the user interface elements to go interactive and for the screen to respond to user input.
- Estimated Input Latency measures how long it takes for a page to respond to user input. The lower the latency, the faster the page will feel. The target for input latency is less than 50 milliseconds.
Accessibility
This section of the report includes various checks for the page format including heading, background and foreground colours, colour contrast, image alt texts, document title tags, and link names. The Google Lighthouse Accessibility section also provides a list of “additional items to manually check,” which contains items that aren’t possible to automate a check to achieve all possible benchmarks.
Below the audit, Lighthouse will display which elements fail to meet its standards. This forms a checklist that users can apply to their pages that can give it maximum impact in terms of SEO, format and visibility.
Best Practices
This section deals with HTTPS, application cache and the safety of cross-origin links. Additionally, it monitors requests for geolocation permission, vulnerable JavaScript libraries, deprecated APIs and whether users can paste into password fields. It also includes image optimisation, JS libraries, browser error logging, known JS vulnerabilities, etc.
SEO
As a basic SEO check, it looks mostly for page tags and status codes. Some parts have to be manually entered, so this section can instruct on meta descriptions, titles, font sizes, etc.
Progressive Web Application
Redirect HTTP to HTTPS, response code ok, fast loading on 3G, splash screen, viewport, etc.
Progressive Web Apps have to be:
Reliable – Load instantly and never show the “downasaur” (the Chrome error page), even in uncertain network conditions.
Fast – Respond quickly to user interactions with silky smooth animations and no janky scrolling.
Engaging – Feel like a natural app on the device, with an immersive user experience.
Related article: How Schema Can Boost Your SEO & Visibility