
SEMrush Sensor: SEO & Keyword Research Made Easy
SEMrush‘s comprehensive toolkit is one of those things all online content makers need to consider having in their arsenal. It provides a handy way of monitoring your traffic and the effectiveness of your keywords along with other fantastic perks. Mainly, SEMrush gives users the ability to chart their success in terms of various metrics and compare said success to that of competitors. One of the key tools within this vital program is the SEMrush sensor, which measures the volatility of search results for any given page.
The sensor can keep track of daily updates in industry and category-based volatility scores, giving users an accurate read-out of Google’s behaviour. In doing so, it provides a good measure of how susceptible to change a certain term is as compared to the rest of Google’s search results. This can apply to specific search terms and keyphrases as well, making it a pretty good measure of judging the viability of future marketing activities.
Here’s how it works:
The Basics

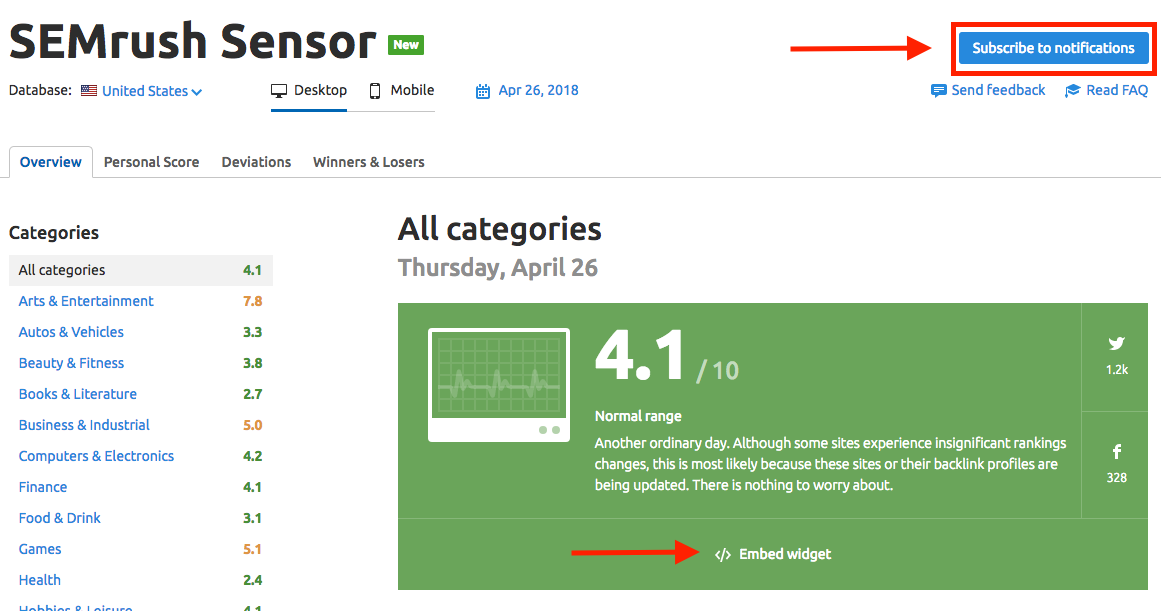
As search trends, user behaviour, and Google’s ranking algorithm change, so can the SEO rankings for specific sites. The Sensor can play a huge role in maintaining your site in order to reflect any potential updates that took place on Google’s side and help mitigate the effects of said changes. It displays this volatility on a scale of 0-10 to indicate how much overall change is happening day to day.
Higher scores indicate a higher level of volatility, while lower scores indicate stability. More specifically, pages ranked between 0-2 are considered low on volatility, with 2-5 acting as normal. Similarly, 5-8 is high and 8-10 is very high. Higher numbers can also mean a change occurred within Google’s algorithm.
The Sensor has another added benefit: you can understand why your page’s SEO and rankings are fluctuating. It can be handy to know whether the root cause is within changes to your strategies and variables or within Google’s algorithm, giving you a clue as to what needs to be done. This can better enable marketers to set up their own future strategies based on more reliable data. It can also be a good way to understand the reasoning behind Google’s algorithm changes and updates.
SEMrush records organic search results for a fixed set of keywords at the beginning and end of each day. Since a score of 5 and above is considered volatile, it may be best to check for changes in the Google search algorithm. When it detects a change, SEMrush will share any publicly shared information about such changes. It will also show such results at the bottom of the reports.
Using SEMrush Sensor
As with many other SEO tools, you have more than one way to set up the SEMrush Sensor to get your readings. Choose the method that suits your workflow the most:
- Subscribe to email notifications. Sign up for email or browser notifications with the blue “subscribe to notifications” button at the top right of the screen on the sensor homepage.
- Embed widget. This has some additional advantages such as allowing you to decide which database and device you want to pull data from, as well as the category. This can provide far more in-depth data.
- Use your URL on the website. You can sign up for the SEMrush website, enter associated keywords and receive a volatility score.
SEMrush SERP Features & Other Data
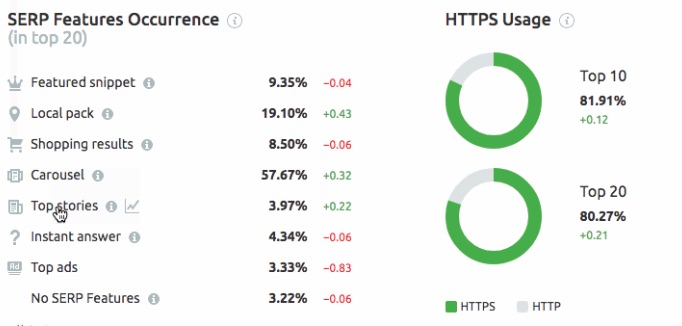
SEMrush’s Sensor also publishes changes in specific search engine result page (SERP) features. These can allow users to categorise their data into specific occurrences that can provide more meaningful read-outs. The SERP Features include:
- Featured snippet
- Local pack
- Shopping Results
- Knowledge panel
- Top stories
- Instant answer
- Top ads
By filtering and comparing these different results, one can find the tinier changes within Google’s algorithm and adjust accordingly with very specific data trends. You can also retrieve reports spanning back for extended time periods, such as a month.
The SERP reports aren’t the only thing one can measure. You can also see how people are using HTTP compared to HTTPS along with the usage of accelerated mobile pages (AMP) which are designed to have pages load quickly when used on a mobile device.
Sensor measures the average movement of the top 20 URLs for every domain that it tracks. This is compiled into the Winners and Losers report, giving users the domains most affected on a daily basis. Users can view the source domain, the average increase or decrease in positions it achieves over 24 hours, the positioning trends, the number of keywords tracked for the domain, and the number of new keywords.
Geographically speaking, the SEMrush Sensor provides area-specific Google data for a number of countries.
- The US
- United Kingdom (Google)
- Germany (Google)
- Italy (Google)
- Spain (Google)
- France (Google)
- Australia (Google)
- Japan (Google)
- China (Baidu)
With all of these tools, the SEMrush Sensor can keep your page in top condition despite changes to Google’s modus operandi and enable you to better plan your content management.
Related article: Why Google Trends Is A Must-Have Marketing Tool